
Logs and Monitoring
The Server Monitor (reached from Logs in the Gateway's primary menu) is the operational view of an instance. Where the Model Workspace is about building, this area is about what the instance is doing right now and what it has recently done.
It's organised into four tabs.
| Tab | Purpose |
|---|---|
| Task Manager | Running and recently finished tasks, including Visual and Scripted Processes |
| Metrics | Runtime health - CPU, memory, disk, request volume and response times |
| Logs | The raw service log |
| FTP | Enable, disable and configure the instance's file transfer service |
Task Manager
The Task Manager lists both running and recently completed tasks, with timestamps and durations. Every Process run - whether triggered by hand, by a Schedule, by a button on a Card, or by an Integration - appears here.
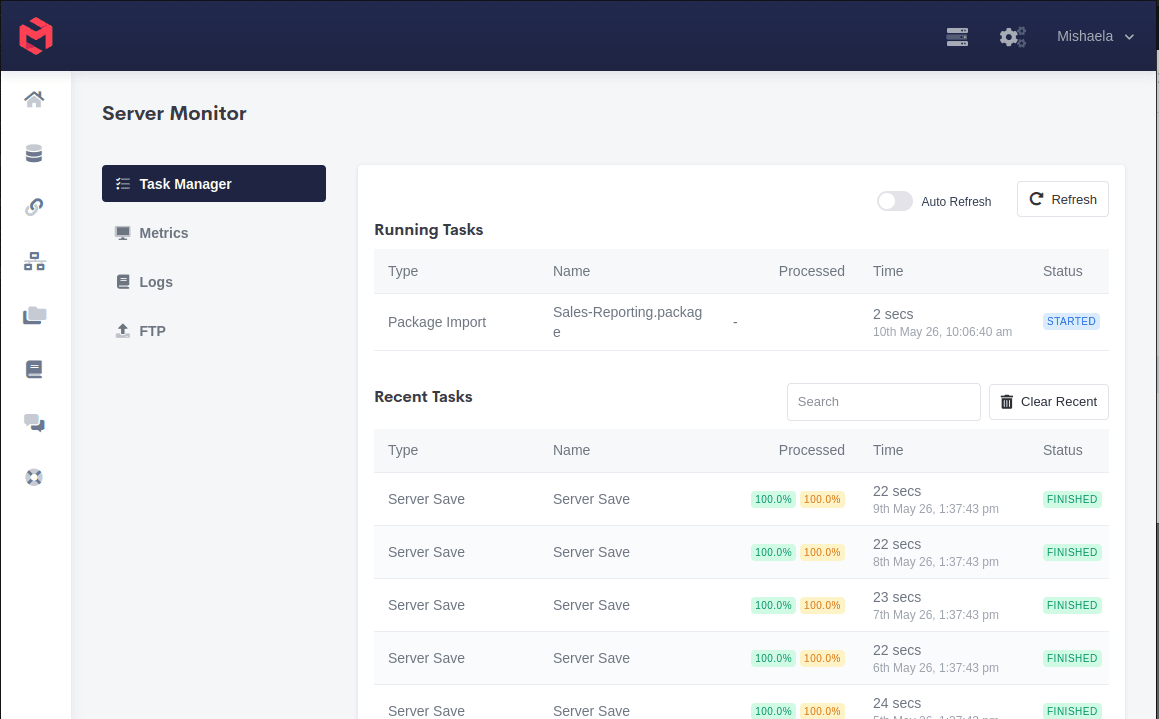
Tasks are split into Running Tasks and Recent Tasks, each showing the task's type, name, progress, elapsed time and status - STARTED while it runs, FINISHED once done. Auto Refresh keeps the view live, and Clear Recent empties the history.
This is the first place to check when a Process didn't do what was expected. A task that's still running explains a Workview showing stale numbers; a task that finished quickly when it normally takes minutes usually means it exited early on an error.
Anything a Process wrote with script.log surfaces against its task - see Logging within a Process for how to instrument a Process so its failures are diagnosable here rather than silent.
Metrics
Metrics reports the runtime health of the instance, as a row of tracked figures above a request profiling chart.
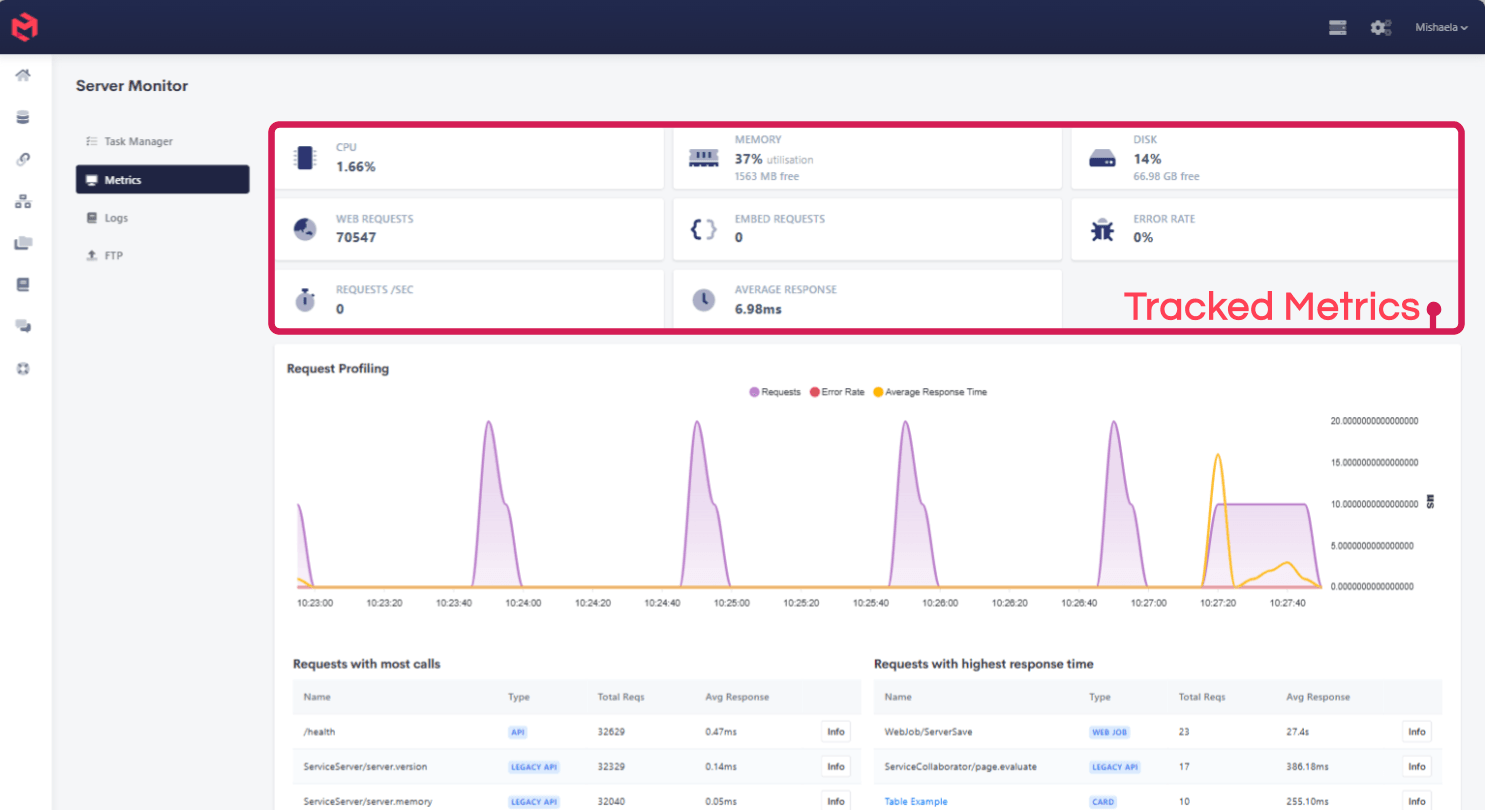
| Metric | What it reports |
|---|---|
| CPU | Processor utilisation. |
| Memory | Percentage utilised, and megabytes free. |
| Disk | Percentage used, and gigabytes free. |
| Web Requests / Embed Requests | Request volume, split between normal access and embed tokens. |
| Error Rate | Proportion of requests failing. |
| Requests /sec / Average Response | Current throughput and latency. |
Memory is the number to watch. MODLR holds a model in memory, so a model that has grown past what its instance was provisioned for shows up here first, as sustained high memory use - and then downstream as slow Workviews and long Process runs. How to optimise your model covers what to do about it, and How to remove unused data from a cube covers reclaiming space that's genuinely dead.
Below the tiles, Request Profiling charts requests, error rate and average response time over time, and two tables break down requests with most calls and requests with highest response time. Each row is labelled by type - API, LEGACY API, WEB JOB, CARD - so a slow Card or a long-running server save can be identified directly rather than inferred.
The headline figures are also available through the API, via server.memory and storage.check - see Restful API.
Logs
The Logs tab shows the raw service log for the instance. It's more verbose and lower-level than the Task Manager, and is mainly useful when a failure isn't explained by the task record alone - a datasource connection that's failing, or an error thrown outside a Process.
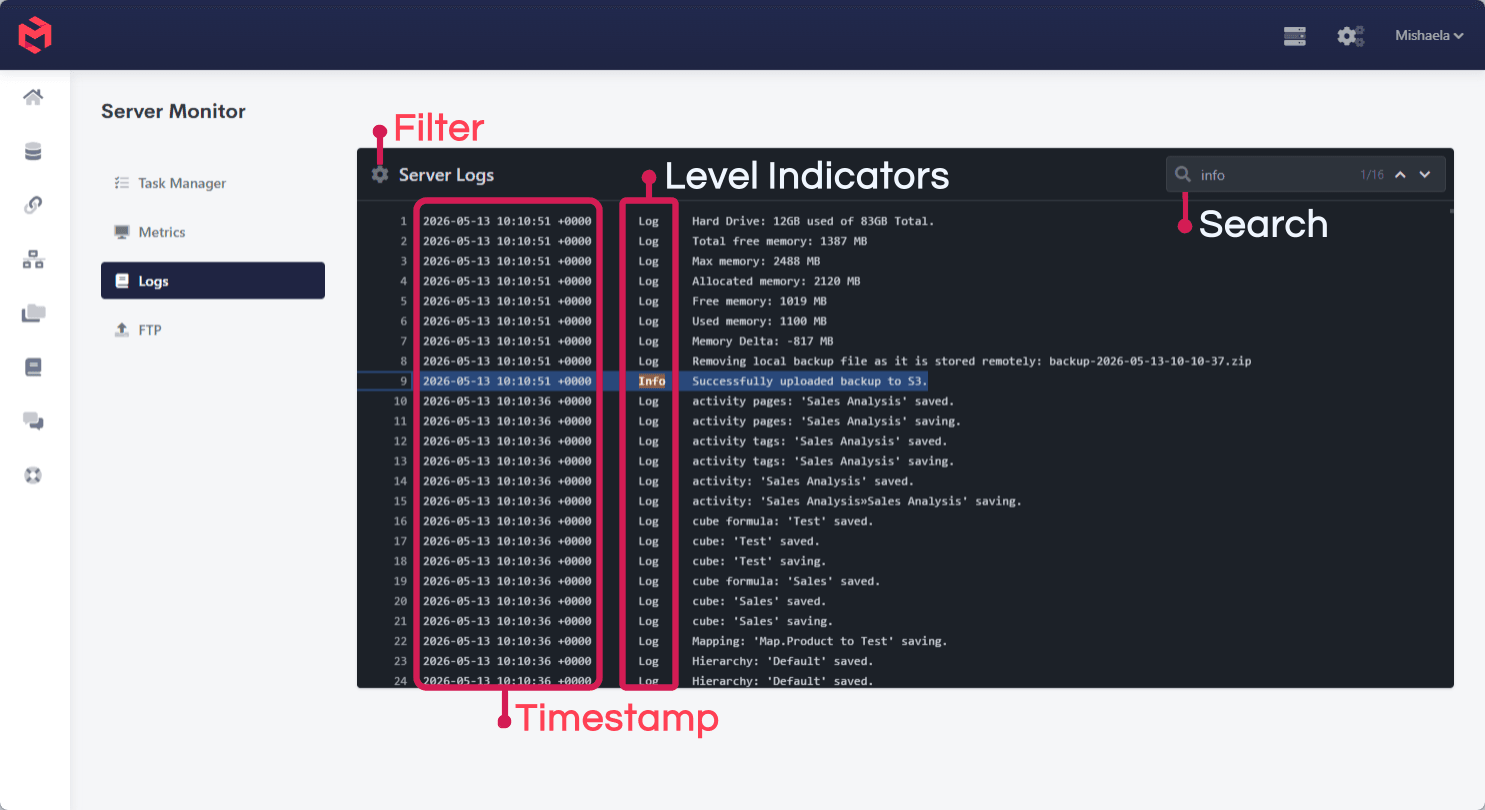
Each line carries a timestamp, a level indicator (Log, Info), and the message. A filter narrows what's shown and a search box jumps between matches. Object saves appear here as they happen - cube: 'Sales' saved., Hierarchy: 'Default' saved. - which makes the log useful for confirming that a Process actually wrote what you expected.
Log timestamps are UTC
Timestamps are stamped +0000, since all MODLR servers run on UTC. See Server time when correlating a log entry against something a user reports in local time.
FTP
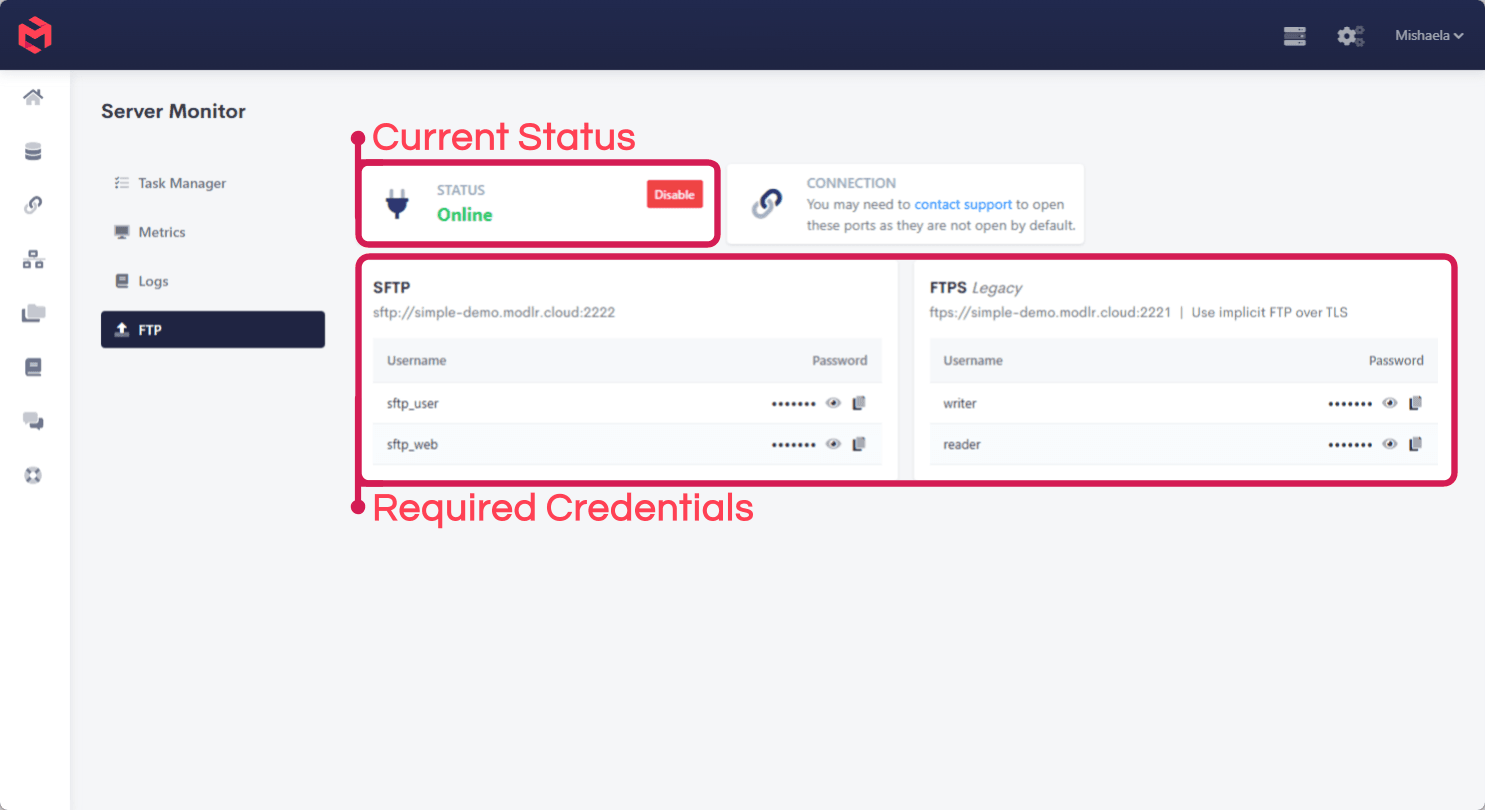
The FTP tab enables, disables and reports the status of the instance's file transfer service, which exposes the instance filesystem for uploading files such as CSVs for processing.
FTP ports are closed by default and must be opened by support before a connection can be made. See Accessing Files via FTP for the full setup, and SFTP for the recommended protocol.
Related
- Navigation within MODLR - where this area sits in the Gateway
- How to restart a server - restarting an instance, and what a restart makes permanent
- Restful API - the equivalent server functions, callable from the Sandbox