About Cubes
Cubes
A cube is a data structure that stores data in a multidimensional form and enables fast querying and analysis of the data.
A cube is made up of dimensions, and cells. Dimensions are the categorical variables of the data, such as geographic location, product, or time period. Cells are the intersection points between each of the dimensions elements, and they contain the aggregated data values for a particular combination of dimension elements (one element from each dimension).
For example, a sales data cube might have dimensions for geographic location, product, time period, and a measures dimension which includes sales revenue and profit. Each cell in the cube would contain the aggregated sales revenue and profit for a particular combination of location, product, and time period.
Cubes store the data at a summary or non-transactional level, which allows for quick access to the data without having to perform sumations of transactional data on the fly. This makes cubes well-suited for analyzing large amounts of data, particularly when the data is changing slowly over time.
Visual example of a Cube
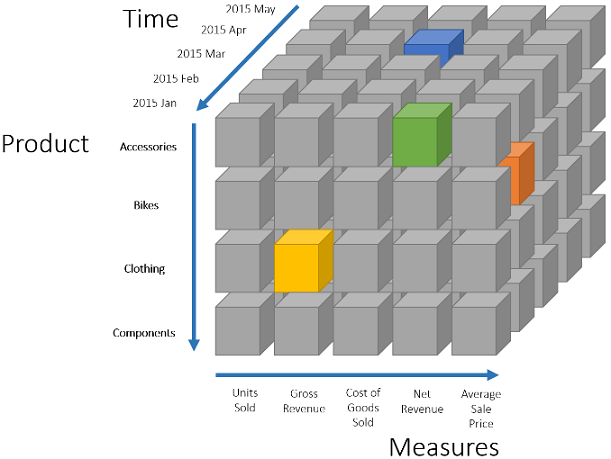
- Each data point in a cube is at a specific cell (intersection) of a single element from each of the dimensions in the cube.
- The last Dimension within a Cube is always the Measures dimension. Where other Dimensions categorise the information by Business Entities (Department, Account, Product etc.), the Measures Dimension tells us what the information being stored is (Dollars, Units Sold, Discount %, Revenue, Sell Price etc.).
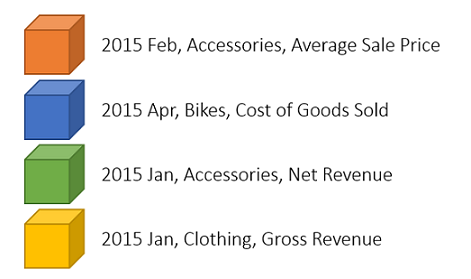
- The address of a cell (intersection) is named using each of the elements which help identify the cell.
Below is a diagram of a three-dimensional data cube with dimensions: Time, Product and Measures.
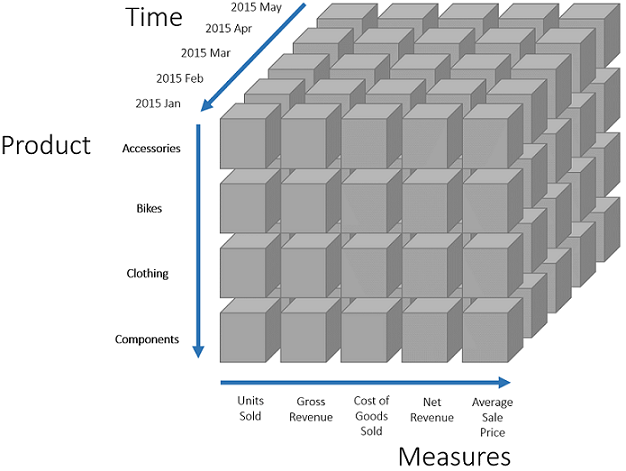
This diagram shows a simplistic view of a data cube with three dimensions. Time, Product and Measures. Time and Product Dimensions are categorising the Cube Intersections (Cells) and the Measures Dimension is telling us what the Data is Representing.
Reporting on Cubes
Due to the multi-dimensional nature of data cubes, additional components are used to create two-dimensional slices of the cube for reporting. In MODLR there are two primary reporting components used to return information from a cube, these being Workviews and Cards.
Workview Reporting
Workviews present a view (or slice) of cube data based on an arrangement (pivot) of the cubes dimensions to either the rows, columns, titles (selection) sections of the workview. Workviews are the easiest way to quickly create arrangements of the cube dimensions to return a spreadsheet-like view of the underlying information. With workviews (and unlike Cards) the structure of the resulting data will always be a table of information, this table can be heavily customised though it will always return in a table-like format.
Card Reporting
Cards are a free form reporting layout which allow for components (Labels, Buttons, Lists, Tables, Images, Other Cards etc.) to be arranged and then linked to dimension hierarchies and data-points from cubes. This format is the most flexible as it is not bound to a single cube (like workvews) and can cater for a multitude of user-experiences.
Cards are typically designed as small reusable components which are included on Dashboards or in other Cards.
Automation
The creation of cubes is primarily completed manually but can also be completed via processes.
Once a cube is created, the data is typically loaded via a process but can be loaded via the following methods -
- Sent in via the
MODLR Excel Add-inCubeSendFunction - Entered manually via a
Workview - Entered manually via a
Card - Copy-Pasted into a
Workview - Loaded automatically via a
Processoff any datasource
Here are some common cube automation user-scenarios:
| Scenario | Automation Methodology |
|---|---|
| Budgeting and Forecasting using a Profit and Loss Cube |
|
| Management Reporting using a Profit and Loss Cube |
|
| Sales Planning using a Sales Cube |
|
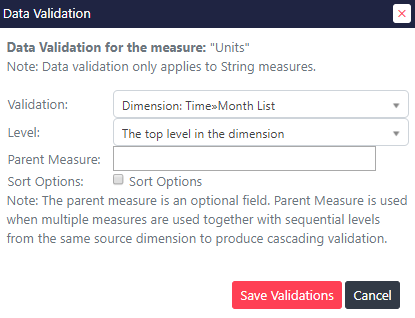
Validations
Cube validation can be applied to the measures dimension, on String Elements. This provides users performing data-entry a list of valid options derived from an existing, mapped, dimension.
To access the Data validation menu:
- Open a workview and ensure the target measure (or measures) are visible in the report.
- Select a data cell associated with the target measure.
- Click the top right menu option for data validation.
In cubes, validation can cascade from one measure to the next allowing for contextual menus to be used for complex mapping processes.
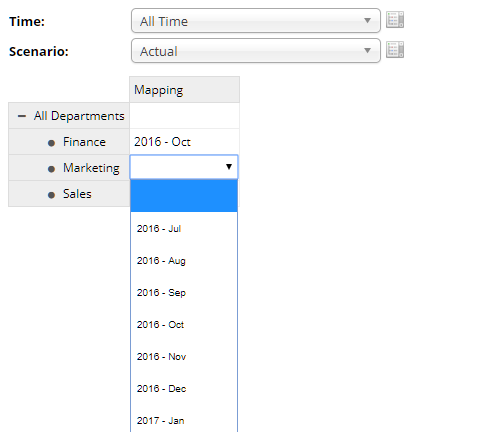
Data validation being applied to a Mapping string element. This example limits valid options to the list of months from the Time dimension.
The validated string measure Mapping upon data-entry displays a list of Months according to its validation rules.