Sales Cube Workviews
We will start by making a simple reporting view showing unit sales by store.
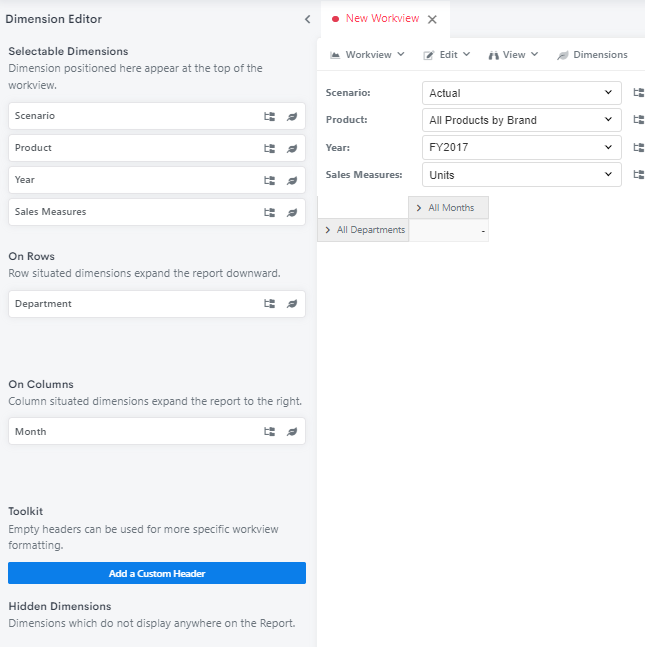
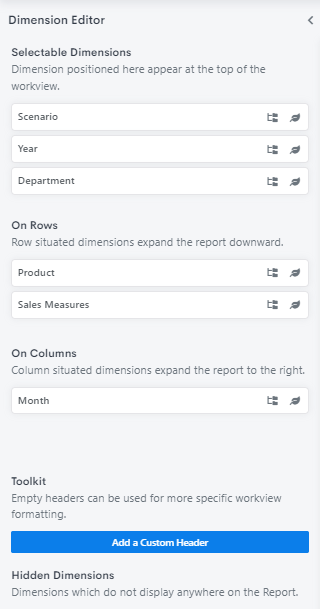
From our model page, double click the Sales cube. Then rearrange the dimensions as shown in the screenshot.
For this we will use the Retail Stores hierarchy from the Department dimension. This will include our brick and mortar stores along with our online sales department.
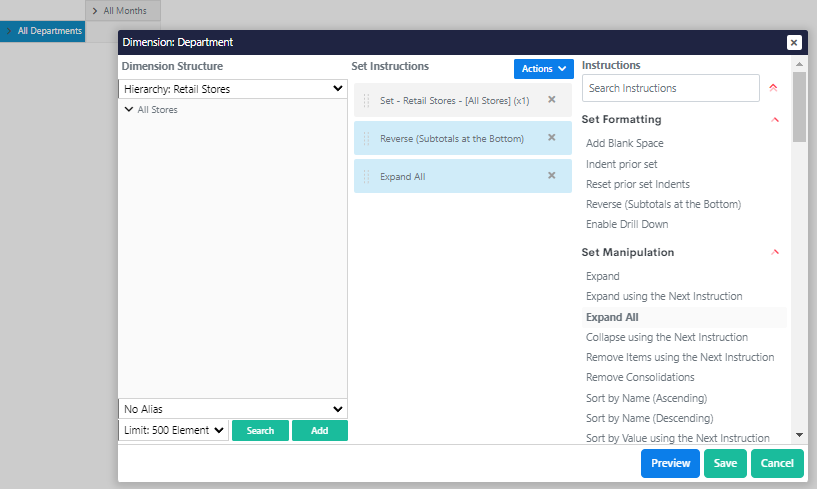
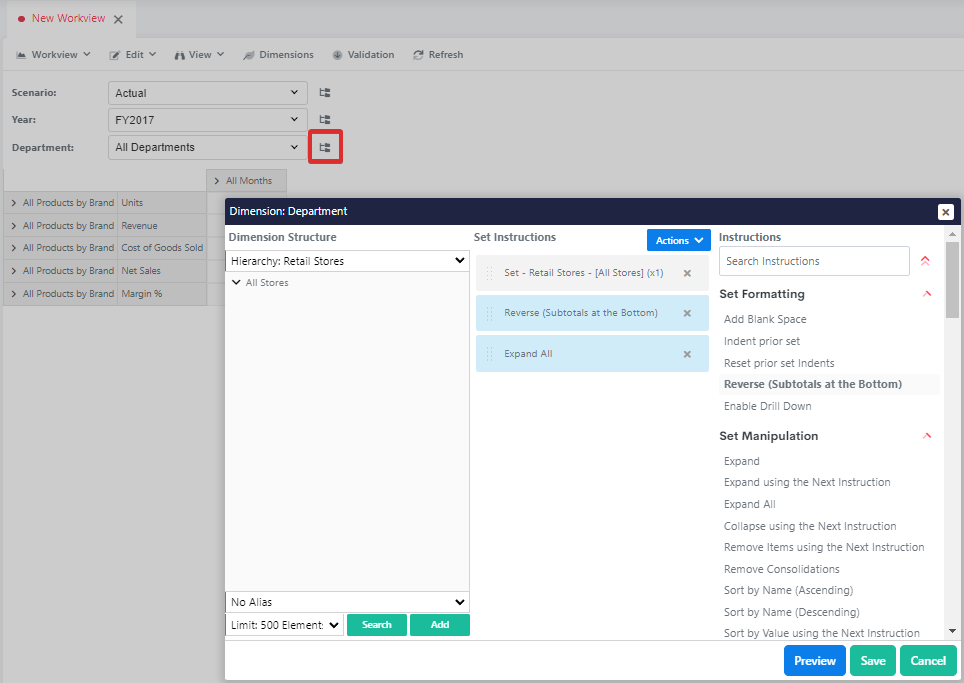
Remove existing instructions. In hierarchy dropdown and choose the Retail Stores hierarchy. Double click on All Stores add Reverse (Subtotals at the Bottom) and an Expand All
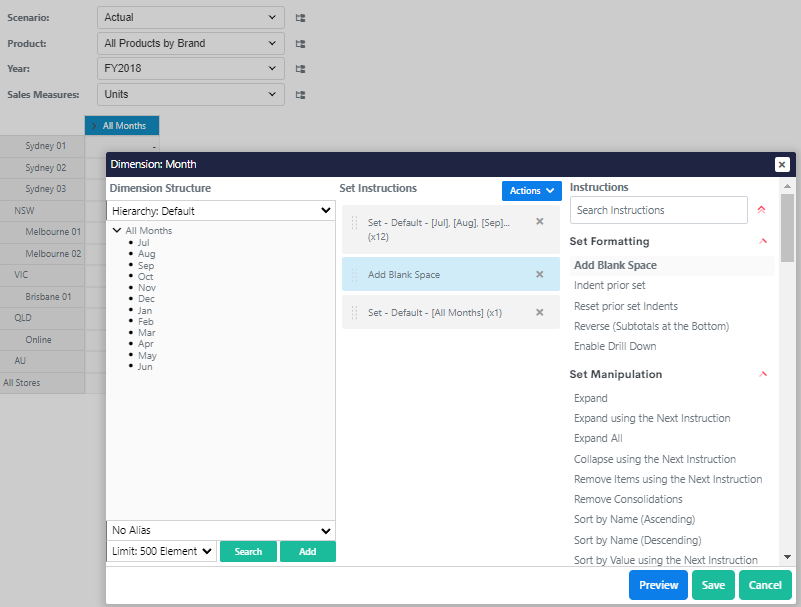
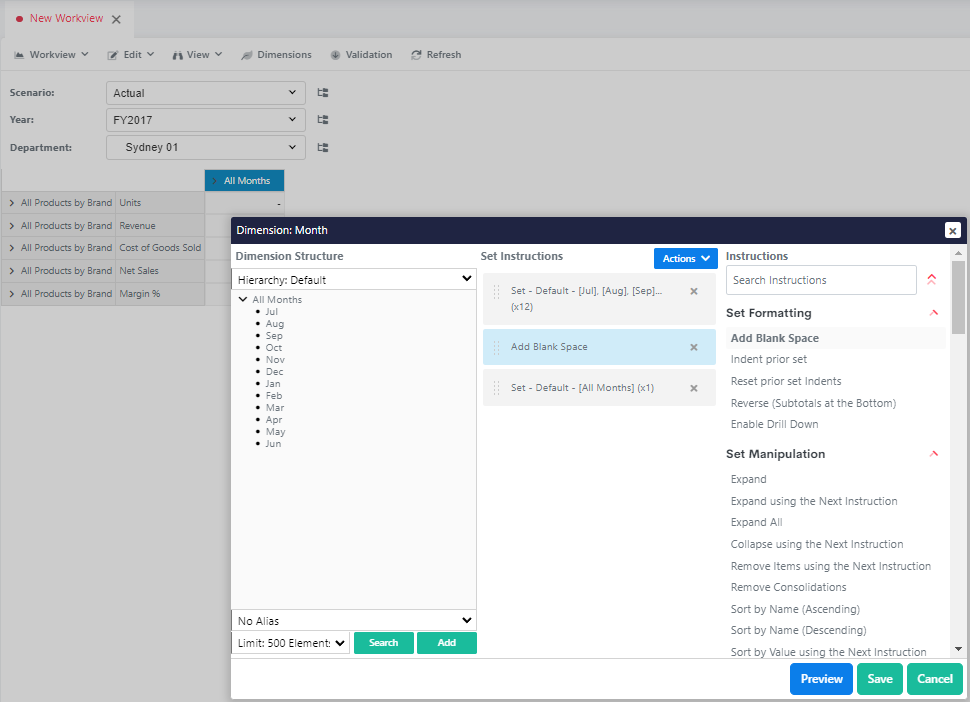
Choose FY2018 in the Year Filter. Double click on the highlighted cell and then expand All Months, select all values and add to set. Then add Add Blank Space and rearrange.
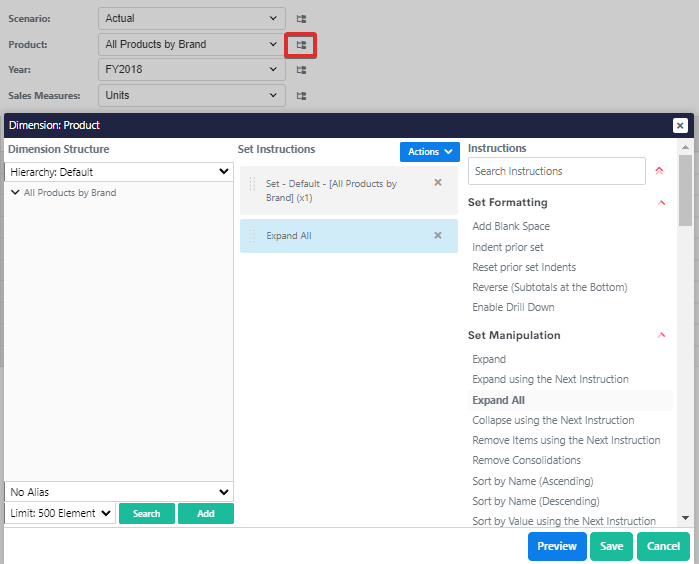
We will also ensure that any Product or Brand is selectable. Click on the highlighted button next to Product filter and add Expand All instruction.
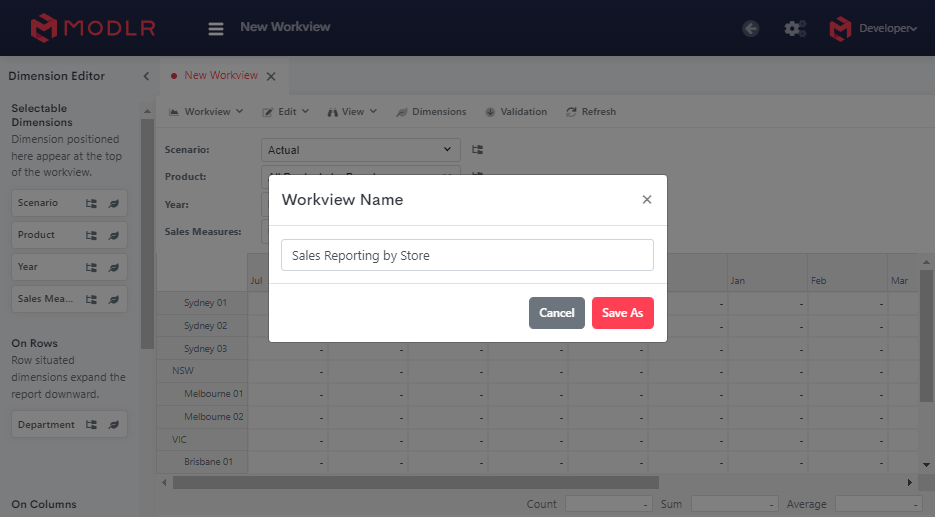
Change the dimension filters as shown in the screenshot and save the workview as Sales Reporting by Store.
Now we can create our planning template for unit sales. From our model page, go to cubes and double-click on the Sales cube and rearrange the dimensions as shown in the screenshot.
Click on the highlighted button next to Department filter and remove the existing instructions from the set. Then select All Stores under Retail Stores hierarchy, add to the set and then add Reverse (Subtotals at the Bottom) and Expand All
Double click on the highlighted cell, expand All Months, drag across the values and add to set. Then add Add Blank Space instruction and rearrange as shown in the screenshot.
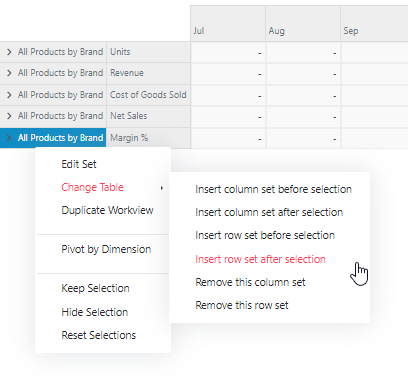
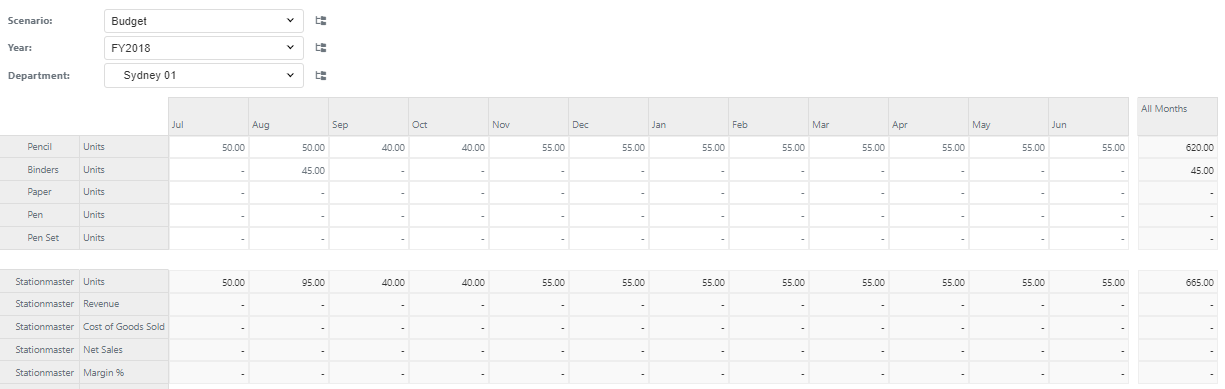
Now we can create our planning template for unit sales. For this template we will use a number of row sets in order to show a different mix of measures and products down the report. Right click on the highlighted cell and go to Change Table → Insert row after selection (thrice).
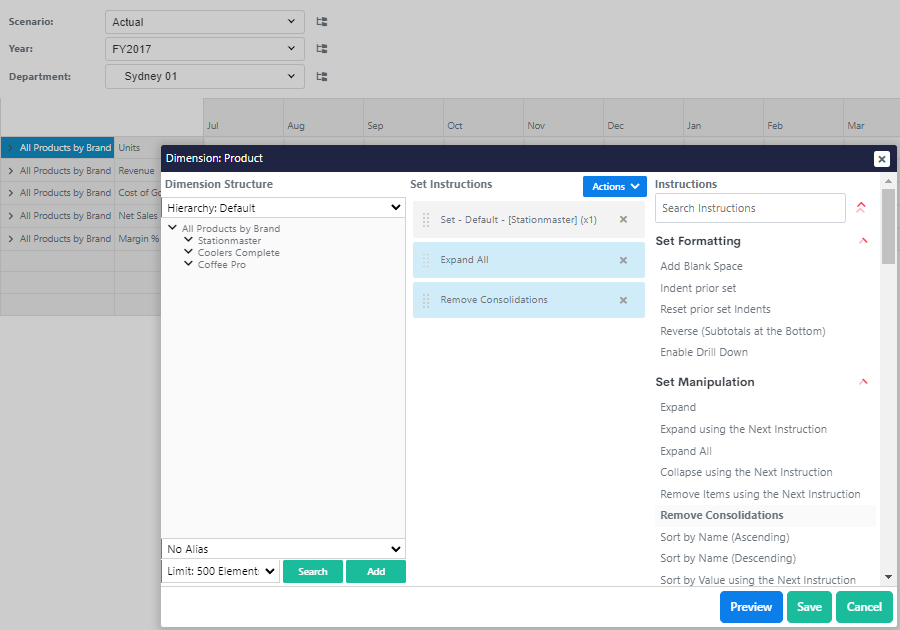
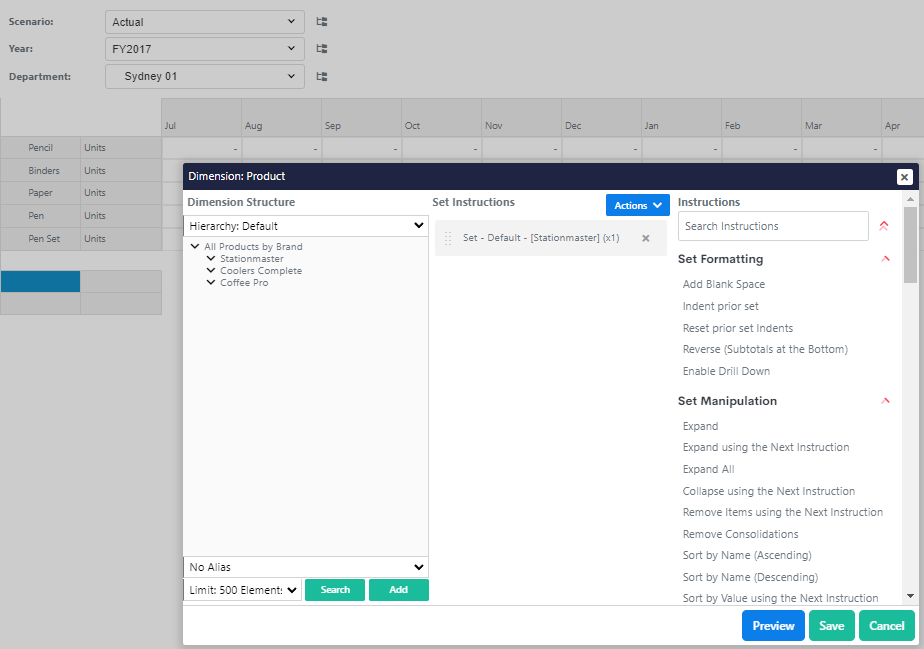
Open the Instruction Editor on the highlighted cell and then expand All Products by Brand, add Stationmaster and add Expand All and Remove Consolidations to the Set Instructions.
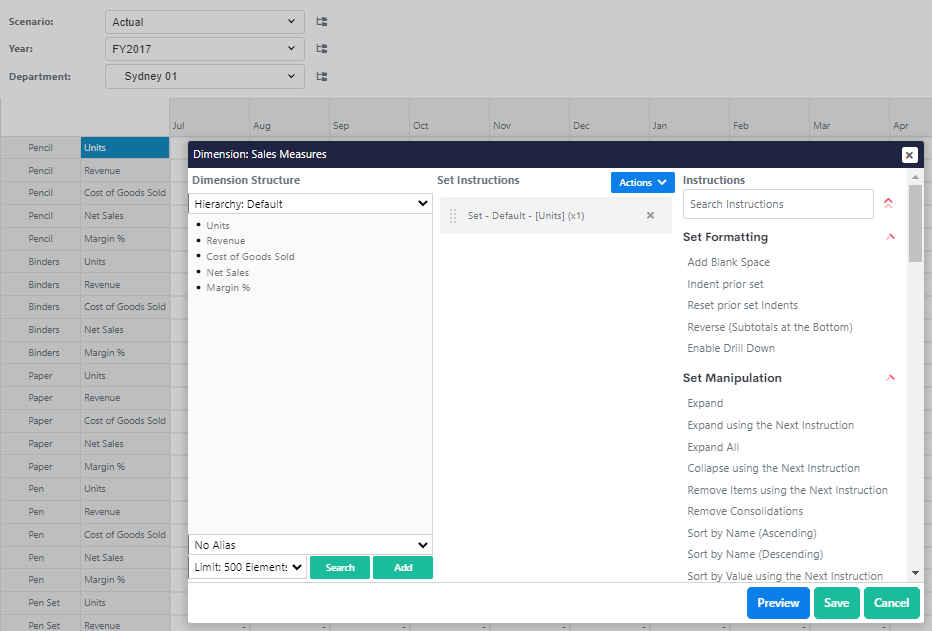
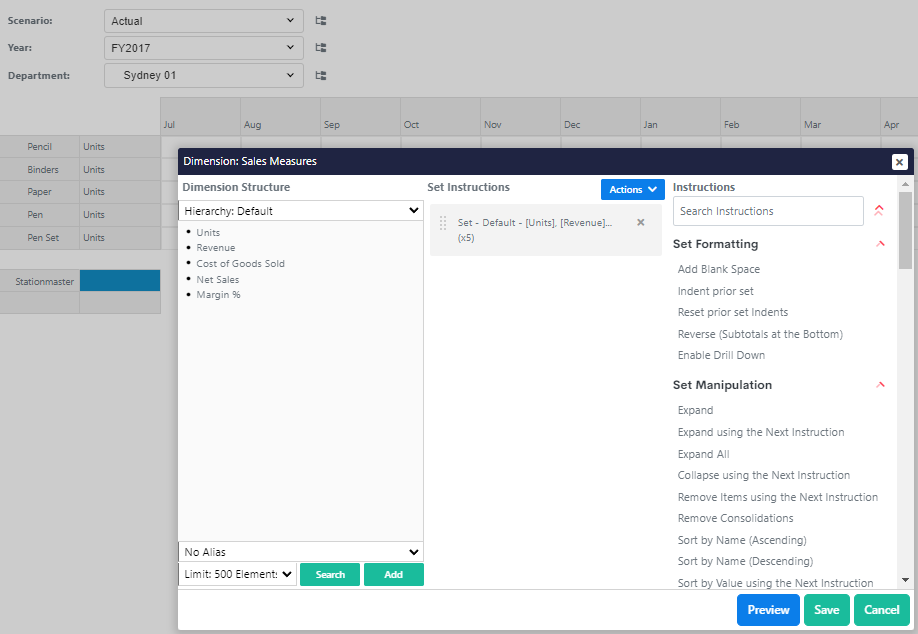
For each product in each brand we will show the units measure so that the user can enter their target unit sales. Double-click on the highlighted cell and remove existing instructions and then add just Units.
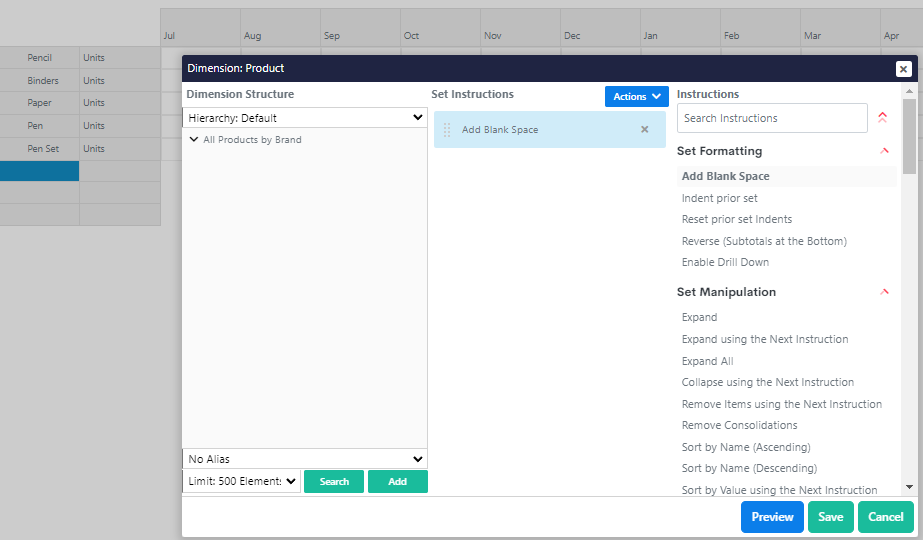
We will add a blank space after the Products. Double click on those cells and then Add Blank Space.
Open Instruction editor from the highlighted cell and remove existing instructions. Then expand All Products by Brand, select Stationmaster, add to instructions.
After each of the products, we will show the brand total where we will show all of the measures.
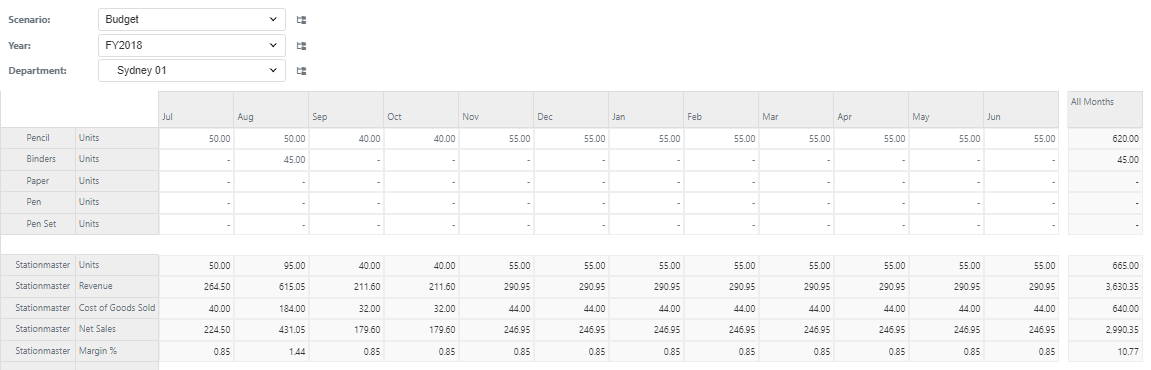
Let's take a break from formatting the report to calculate our measures, starting with Revenue. First, we will add some values to our workview.
Switch to FY2018 and the Budget Scenario
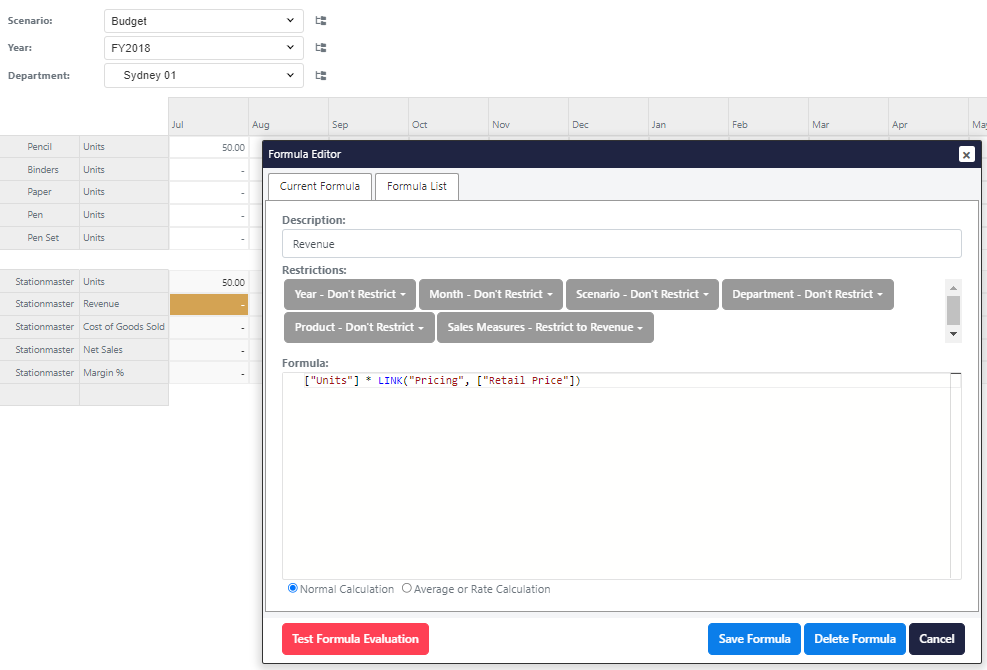
Right click and edit formula on the highlighted cell (in yellow). This formula will be applied to the Budget scenario only and calculate Units multiplied by the Retail Price from our Price cube.
To reference the price within the Pricing cube we need to use the link function. Since both cubes have Year, Month and Scenario dimensions the only argument to this function is the cube name and the target measure to pull from within the Pricing cube.
["Units"] * LINK("Pricing", ["Retail Price"])
The system will automatically match up the elements from dimensions which are common between the cubes and ignores any dimensions which are in the Sales cube but are not in the linked Pricing cube.
Any changes made to the Pricing cube will now directly affect the Revenue line in the Sales cube in real time.
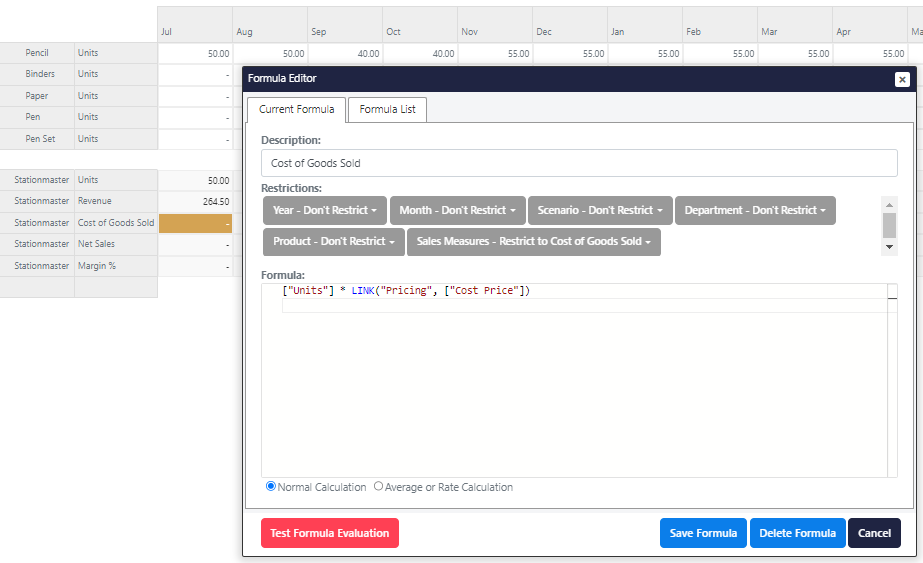
We will calculate the Cost Price measure. Right click and edit formula on the highlighted cell (in yellow).
["Units"] * LINK("Pricing", ["Cost Price"])
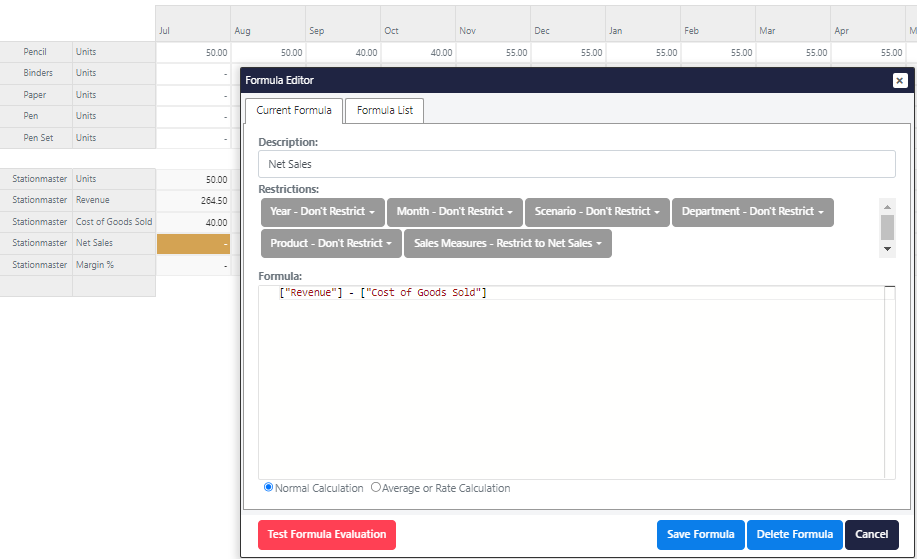
We will calculate the Net Sales measure as well. Right click and edit formula on the highlighted cell (in yellow).
["Revenue"] - ["Cost of Goods Sold"]
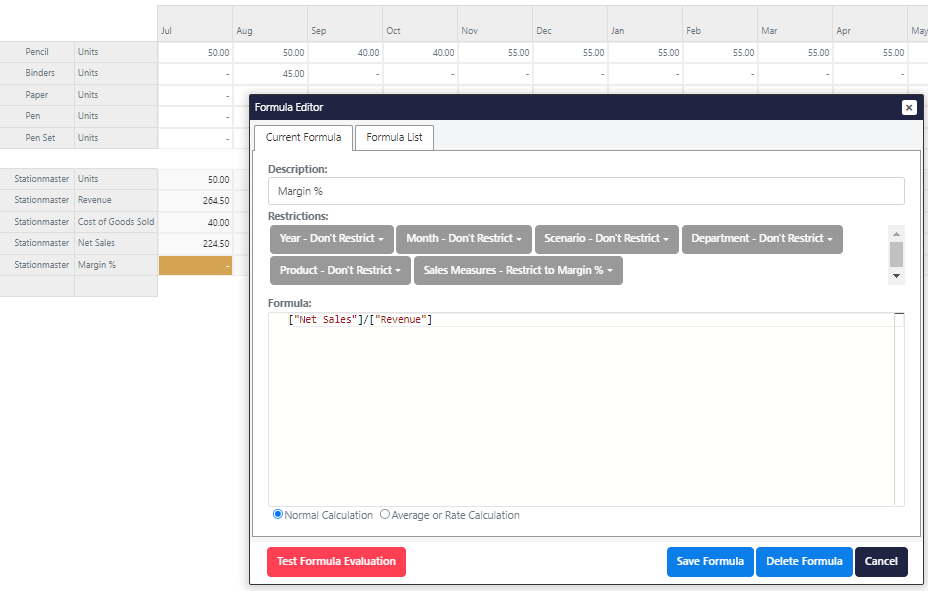
We will calculate the Margin % measure as well. Right click and edit formula on the highlighted cell (in yellow).
With this margin calculation we could also change the type from Normal Calculation to Average or Rate Calculation. This would ensure that the formula calculates at all levels of the cube and prevents the percentages from adding up.
For now, we're going with Normal Calculation.
["Net Sales"]/["Revenue"]
Save as Sales Planning by Product