
The Card Editor
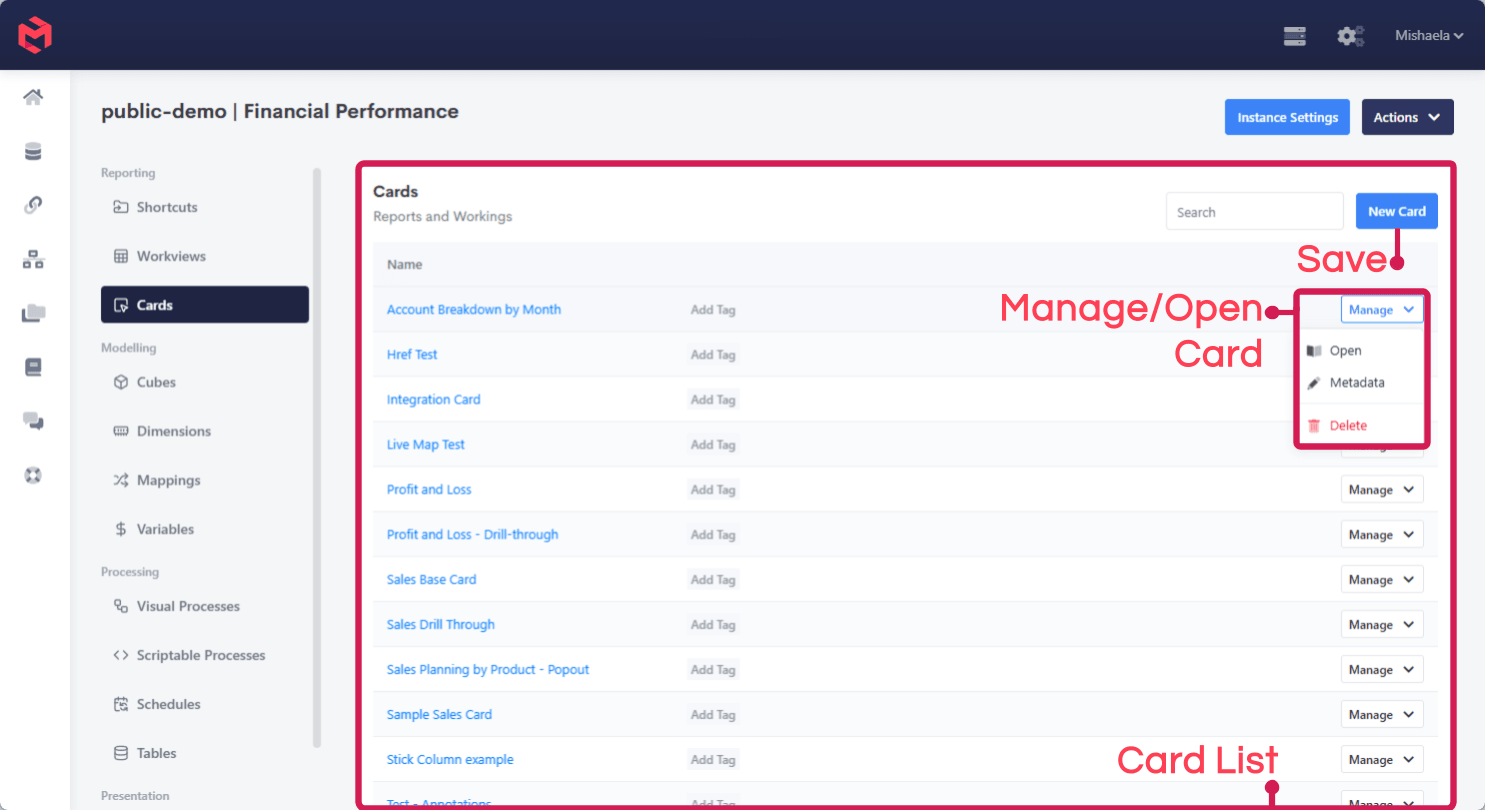
Cards are built in the Card Editor, reached from Cards under Reporting in the model's navigation panel.
Finding and opening a card
The Cards listing shows every card in the model. New Card creates one, and each row's Manage menu opens it, edits its metadata, or deletes it.
The editor
Opening a card gives you the editor. Its regions are described in Components Basics; the short version is a component library on the left, the canvas in the middle, context/variables and properties on the right, and the preview beneath.
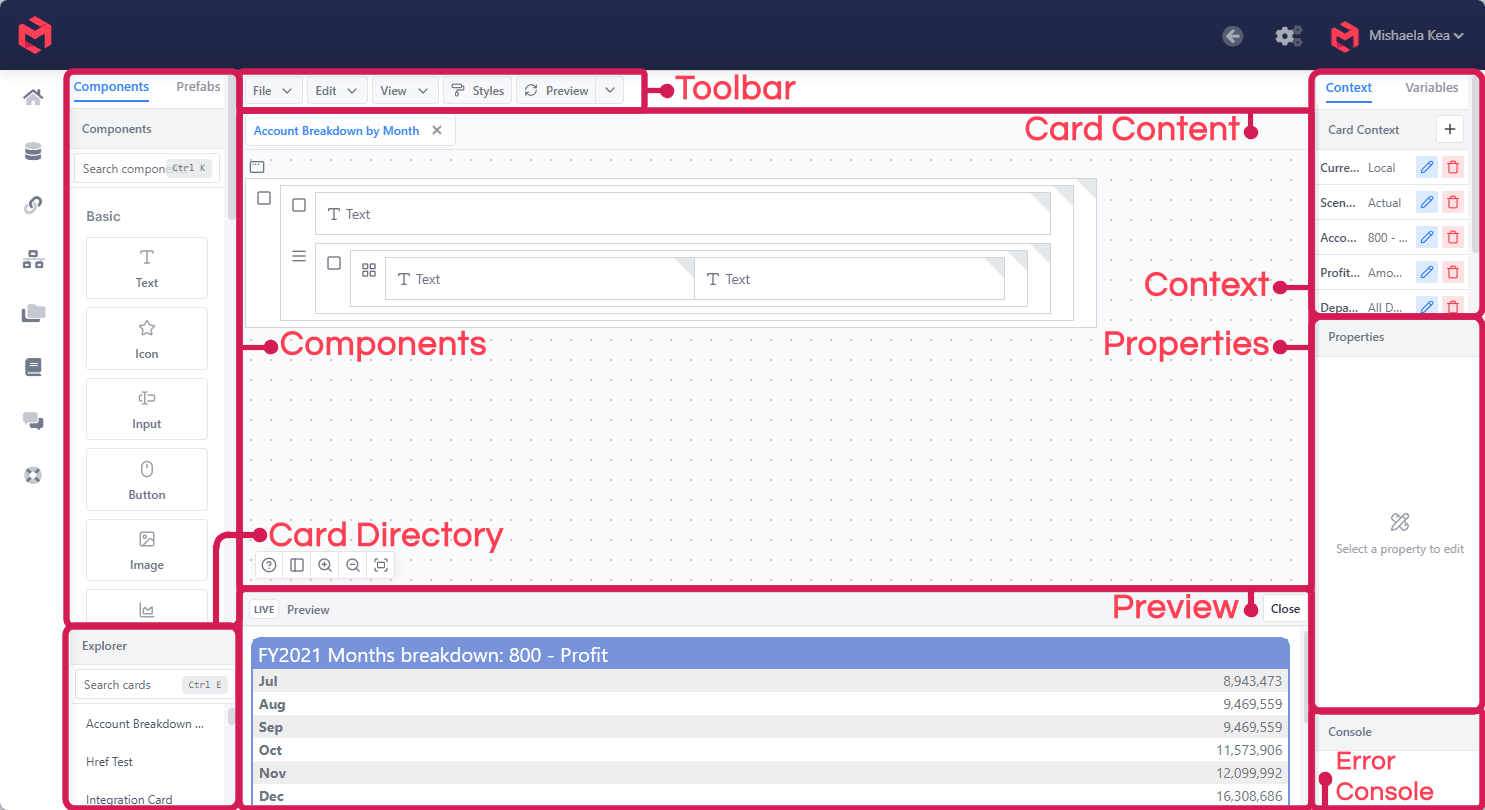
The Explorer at the bottom left searches every card in the model (Ctrl E), which is how you jump between cards without going back to the listing.
Preview
Preview renders the card as an end user sees it, in a pane below the canvas. Because a card's properties can be formula-driven and its content depends on context, the preview is the only reliable way to see what a change actually did.
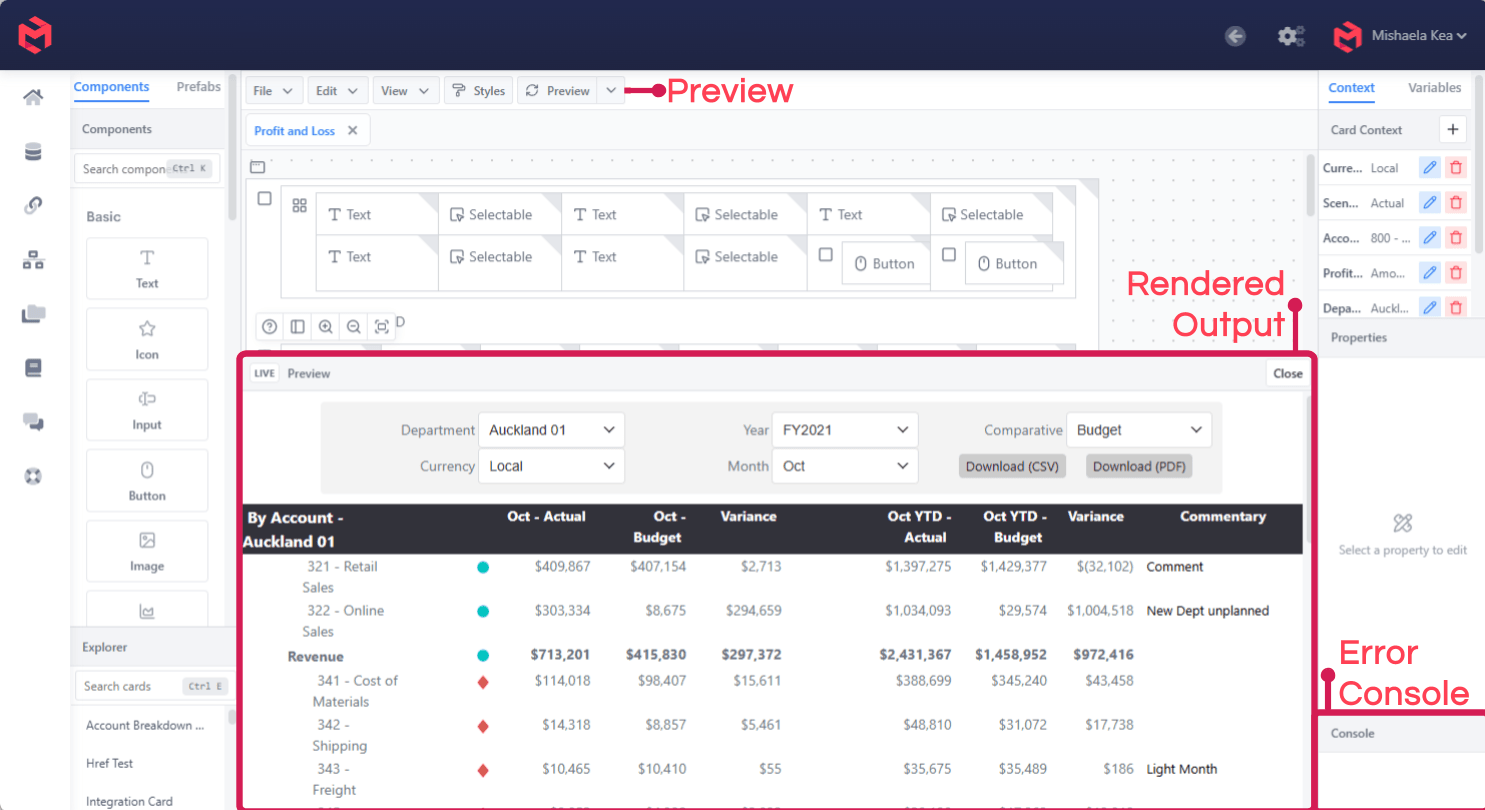
The preview is interactive - selectables, buttons and inputs behave as they would for an end user - so a drill-through or a context change can be tested without leaving the editor.
Error console
The Console at the bottom right reports errors raised while the card renders. A component that silently shows nothing is usually explained here - a formula referencing an element that doesn't exist, or a SQL component whose query failed.
For tracing context and variables at a specific point in the card rather than errors alone, add the Debugger component.
Profiler
Every render reports its total time in a badge at the top of the editor. Clicking it opens the Profiler, which breaks that time down by component.
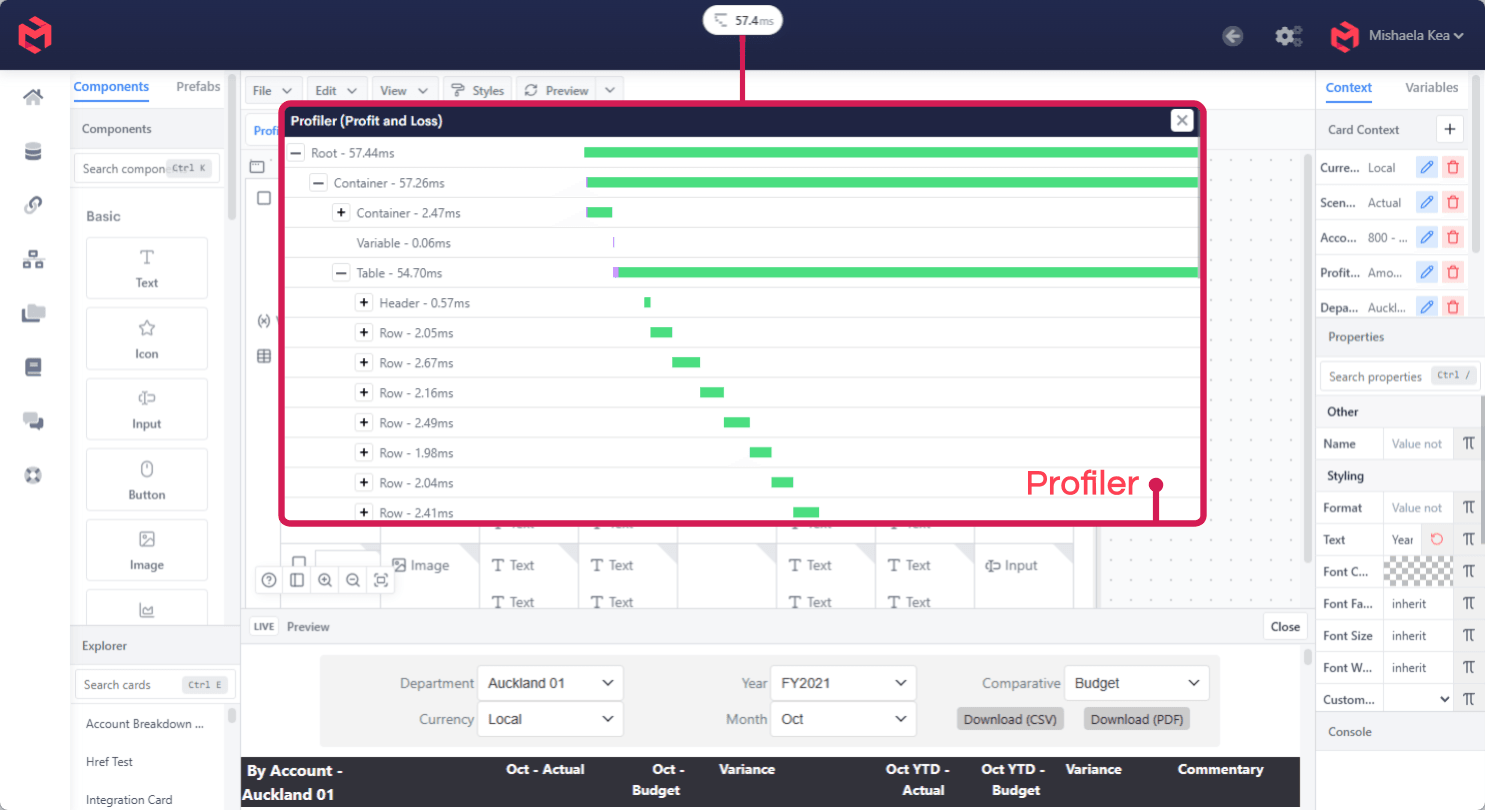
The breakdown is a tree that mirrors the card's own structure - root, then each container, then the components inside it, down to individual table rows - with a bar showing each one's share of the total.
This is how you find what makes a slow card slow. A card taking several seconds is rarely uniformly slow: usually one table, one formula-driven property, or one SQL component accounts for most of it, and the profiler names it directly rather than leaving you to bisect the card by deleting components.
Read the tree, not just the total
A container's time includes everything nested inside it, so the root always shows the largest number. What matters is where the time stops being inherited and starts being spent - the deepest node still holding most of the total.
Related
- Components Basics - the editor's panels and how properties work
- Debugger Component - inspecting context and variables mid-card
- Cards in Screens - publishing a finished card